Dataset extent
Vesimuodostumakohtaiset statistiikat asemahavainnoista VPD luokittelujaksoilta 2000–2023. Koostettu Vesla-tietokannan näytteenotosta / Water body statistics based on water samples for water formations on WFD classification periods between 2000 to 2023. Aggregated from water samples on Vesla database.
Data ja resurssit
Lisätietoja
| Kenttä | Arvo |
|---|---|
| Metatietueen ID | {1FF07BAB-166D-4BDC-83EE-432A1936BC7C} |
| Metatiedon pääasiallinen kieli | fin |
| Metatiedosta vastaava organisaatio | Suomen ympäristökeskus / Finnish Environment Institute (Syke) |
| Metatiedosta vastaavan organisaation yhteystieto | eotuki@syke.fi |
| Metatiedosta vastaavan organisaation rooli | pointOfContact |
| Metatiedon päivityspäivämäärä | 2026-02-26 |
| Koordinaattijärjestelmän EPSG-koodi, ks. https://epsg.io | EPSG:3067 |
| Palvelun päivämäärä | 2026-02-05 |
| Palvelun päivämäärän tyyppi | publication |
| Palvelun yksilöivä tunnus | |
| Palvelusta vastaava organisaatio | Suomen ympäristökeskus / Finnish Environment Institute (Syke) |
| Palvelusta vastaavan organisaation yhteystieto | eotuki@syke.fi |
| Palvelusta vastaavan organisaation rooli | pointOfContact |
| Esimerkkikuva | 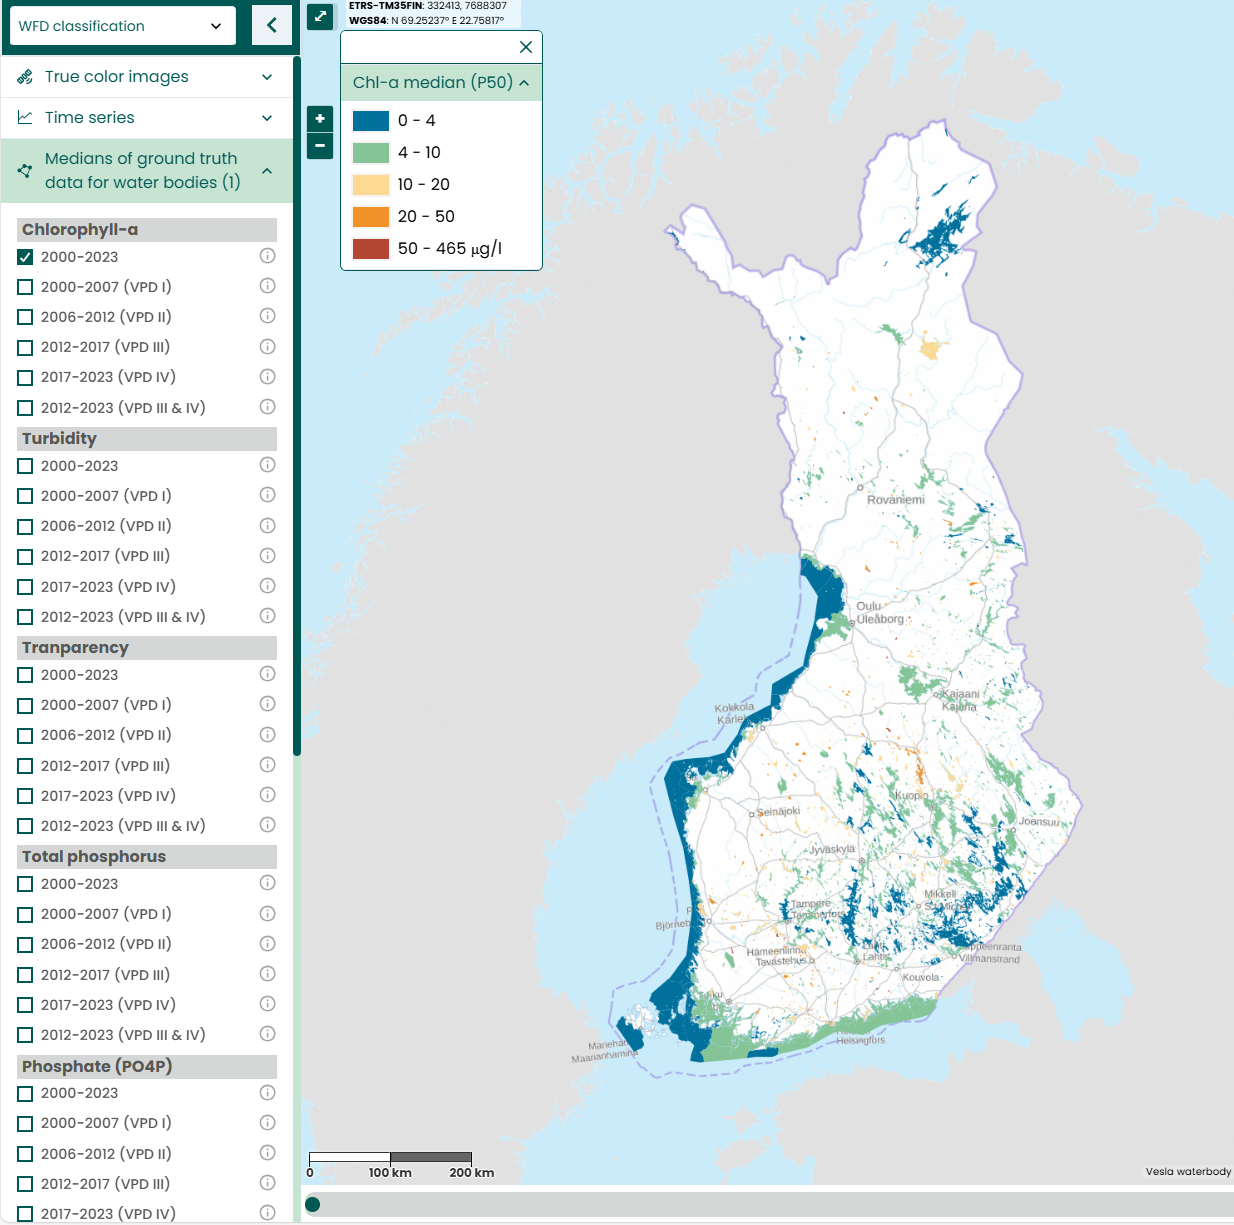 |
| INSPIRE-teema | Administrative units |
| INSPIRE-teema | Sea regions |
| GEMET-asiasana | coastal water |
| GEMET-asiasana | surface water |
| GEMET-asiasana | water quality |
| GEMET-asiasana | Water Framework Directive |
| GEMET-asiasana | ecological assessment |
| GEMET-asiasana | inland water |
| GEMET-asiasana | eutrophication |
| GEMET-asiasana | monitoring |
| GEMET-asiasana | water body |
| GEMET-asiasana | water monitoring |
| Resurssityyppi | Paikkatietoaineisto |
| Muut asiasanat | Ei-Inspire |
| Muut asiasanat: sanaston nimi | |
| Muut asiasanat | Tarkka |
| Muut asiasanat: sanaston nimi | |
| Muut asiasanat | status assessment |
| Muut asiasanat: sanaston nimi | |
| Muut asiasanat | water quality |
| Muut asiasanat: sanaston nimi | |
| Muut asiasanat | water sample |
| Muut asiasanat: sanaston nimi | |
| Muut asiasanat | in-situ |
| Muut asiasanat: sanaston nimi | |
| Muut asiasanat | aggregate |
| Muut asiasanat: sanaston nimi | |
| Muut asiasanat | time series |
| Muut asiasanat: sanaston nimi | |
| Muut asiasanat | designated monitoring station |
| Muut asiasanat: sanaston nimi | |
| Käyttörajoitteet ja lähdemerkintä | Aineisto ei kuulu Syken avoimiin aineistoihin. Käyttötarkoitus Syken ja Elinvoimakeskusten vedenlaatuluokittelijoiden tukiaineisto. Not an open Syke dataset. Planned usage: Supportive dataset for water quality classification experts in Syke and Economic Development Centres |
| Saantirajoitteet | Public access to spatial data sets and services would adversely affect intellectual property rights. |
| Aineiston/järjestelmän tyyppi | vector |
| Aineiston/järjestelmän kieli | fin |
| Aineiston/järjestelmän aiheluokka | environment |
| Aineiston/järjestelmän aiheluokka | inlandWaters |
| Aineiston/järjestelmän aiheluokka | oceans |
| Palvelun tyyppi | |
| Ajallisen kattavuuden alku | 2000-01-01 |
| Ajallisen kattavuuden loppu | 2023-12-31 |
| Palvelun historiatiedot | [FI] Pintavesien tilan tietojärjestelmän vedenlaatuosio (Vesla) sisältää pääasiassa vesiviranomaisten seurannan sekä vesistöjen velvoitetarkkailun vedenlaadun tarkkailuissa analysoimia fysikaalis-kemiallisia määritystuloksia järvistä, joista ja rannikkovesistä. Tietojärjestelmästä haetuista vesinäytteistä on laskettu koosteet visualisointityökaluksi Suomen vesiviranomaiskäyttöön. [EN] The water quality section (Vesla) of the surface waters status information system contains mainly the physico-chemical analysis results from lakes, rivers, and coastal waters produced by water authorities’ monitoring and by mandatory waterbody monitoring programmes. Aggregates have been calculated from the water samples retrieved from the information system. The aggregates are a visualization tool for use by Finland's water authorities. |